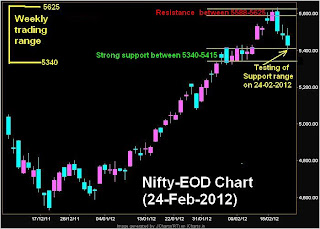
Nifty-EOD Chart(24-Feb-2012):-
1- Resistance through 3 days selling between 5588-5625
2- Strong support between 5340-5415
3- Testing of Support range on 24-02-2012
4- Weekly trading range 5340-5625
Correction commenced after good selling between 5588-5625 therefore complete consolidation is required to cross 5625 and in the same manner strong supports also between 5340-5415 therefore complete distribution is must for slipping below 5340. Although Nifty tested mentioned support range and closed above it but both supports and resistances both are sufficiently strong and market require complete preparation for breaking out of these 2 Resistance/support ranges.
Expected that Nifty will firstly trade minimum 2/3 sessions between 5340 and 5625 and prepare for next moves and sustaining below 5340 will mean deeper correction after breaking down of strong support ranges,sustaining above 5625 will mean strong rally after correction completion.
 |
| Just click on chart for its enlarged view |
Technical Patterns and Formations in EOD charts
1- Resistance through 3 days selling between 5588-5625
2- Strong support between 5340-5415
3- Testing of Support range on 24-02-2012
4- Weekly trading range 5340-5625
Conclusions from EOD chart analysis
Correction commenced after good selling between 5588-5625 therefore complete consolidation is required to cross 5625 and in the same manner strong supports also between 5340-5415 therefore complete distribution is must for slipping below 5340. Although Nifty tested mentioned support range and closed above it but both supports and resistances both are sufficiently strong and market require complete preparation for breaking out of these 2 Resistance/support ranges.
Expected that Nifty will firstly trade minimum 2/3 sessions between 5340 and 5625 and prepare for next moves and sustaining below 5340 will mean deeper correction after breaking down of strong support ranges,sustaining above 5625 will mean strong rally after correction completion.

