

Pull Back rally continuation after follow up consolidation
Technical Analysis,Research & Weekly Outlook(Feb 01 to Feb 05,2016)
Nifty-EOD Chart (29-Jan-2016):-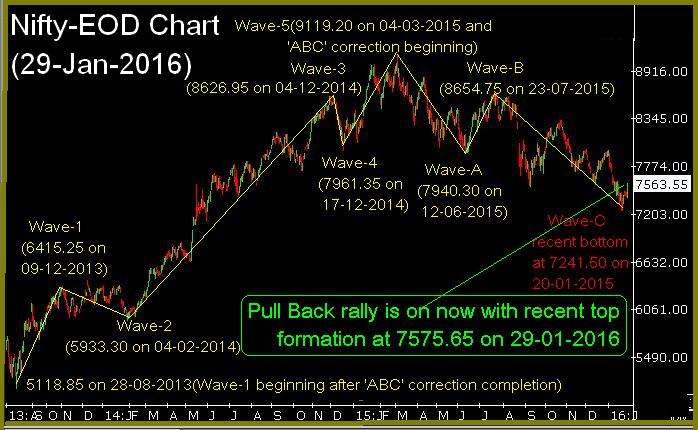 |
| Just click on chart for its enlarged view |
1- 5118.85 on 28-08-2013(Wave-1 beginning after 'ABC' correction completion)
2- Wave-1(6415.25 on 09-12-2013)
3- Wave-2(5933.30 on 04-02-2014)
4- Wave-3(8626.95 on 04-12-2014)
5- Wave-4(7961.35 on 17-12-2014)
6- Wave-5(9119.20 on 04-03-2015 and 'ABC' correction beginning)
7- Wave-A(7940.30 on 12-06-2015)
8- Wave-B(8654.75 on 23-07-2015)
9- Wave-C recent bottom at 7241.50 on 20-01-2016
10- Pull Back rally is on now with recent top formation at 7575.65 on 29-01-2016
10 Months Correction in Bullish Flag formations
Nifty-EOD Chart (29-Jan-2016):-
 |
| Just click on chart for its enlarged view |
1- 5118.85 on 28-08-2013
2- Wave-5 completion at 9119.20 on 04-03-2015 and Wave-A of 'ABC' correction beginning after life time high formation)
3- Recent bottom of correction at 7241.50 on 20-01-2016
4- 10 Months correction in Bullish Flag formations
Fibonacci Retracement levels of on going ABC Correction
Nifty-EOD Chart (29-Jan-2016):-
 |
| Just click on chart for its enlarged view |
1- 5118.85 on 28-08-2013(Wave-1 beginning after 'ABC' correction completion)
2- Wave-5 completion at 9119.20 on 04-03-2015 and 'ABC' correction beginning
3- Wave-C continuation with recent bottom formation at 7241.50 on 20-01-2016
4- Crucial 50.0% retracement level is at 7118 which is little below recent bottom
Conclusions (After Putting All Studies Together)
Trends of Nifty are as follows:-
1- Short Term Trend is up
2- Intermediate Term Trend is down and will be up after sustaining above 7721
3- Long Term Trend is down and will be up after sustaining above its decider 200 Day EMA(today at 7971)
That Wave-1 which started on 28-08-2013 from 5118.85 gained 4000 points and completed at 9119.20 on 04-03-2015 after many times new life times high formation and after that its 'ABC' correction started which is in continuation now and no confirmation of its completion yet.
ABC correction of 4000 points rally between 5118-9119 is on which will correct according to following Fibonacci Retracement levels:-
1- 13.0%- 8598
2- 23.6%- 8174
3- 27.0%- 8038
4- 38.2%- 7590(Crucial)
5- 50.0%- 7118(Crucial)
6- 61.8%- 6646(Crucial)
7- 70.0%- 6290
8- 76.4%- 6062
9- 78.6%- 5974
10-88.6%- 5574
Next supports of Nifty are as follows
1- 7420-7447
2- 7242-7320
Next resistances of Nifty are as follows
1- 7552-7606
2- 7614-7640
3- 7675-7721(Gap)
Whole 10 months correction from 9119.20 to 7241.50 in Falling channel with Bullish Flag formations. As Flag will remain valid up to near about 7100 and 50% retracement level is also near it at 7118 therefore strong possibility of correction completion will be considered near about 7100. If on going correction finally completes above 7100 then that will be confirmation of Bullish Flag validity which will mean fresh rally above life time high(9119.20) after 18 months(Aug,28 2013-Apr,04 2015) long and 4000 points(5118.85-9119.20) rally correction completion.
Although 334 points strong recovery from lower levels in last 7 sessions but no confirmation of on going big correction completion which will be considered after sustaining above Long Term Trend decider 200 Day EMA(today at 8971).
Certainly Pull Back Rally is on and its continuation will be seen because no selling pattern yet but a Bullish development last Friday after 3 Sessions Trading Range forcefully broken out that day.
As Very Short Term oscillators turned overbought after last 7 sessions rally and resistances are also lying just above previous session highest therefore intraday correction from intraday higher levels may be seen any day but finally Pull Back rally continuation is expected after follow up consolidation between above mentioned levels.